The fine folks working on the Richmond Transit Network Plan have released something really neat: A make-your-own isochrone tool.
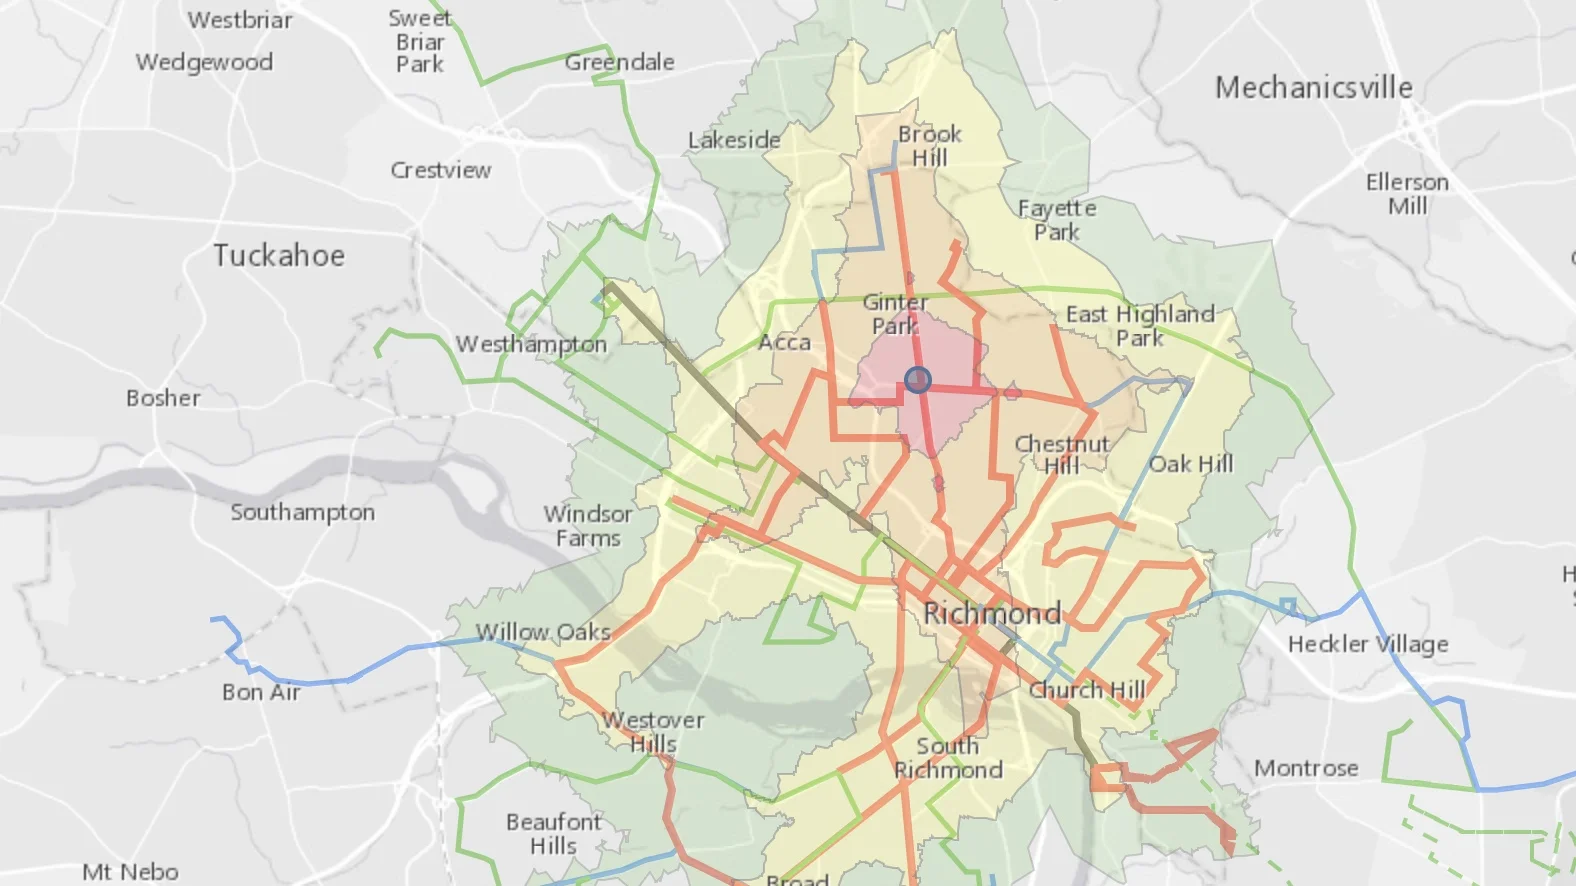
If you've looked at any of the RTNP materials, you've probably already seen a bunch of isochrones. They're the cool maps with concentric, bubbly shapes emanating from some central point. As you get father away from the point, the bubbles change color marking the amount of time it'd take to transit from the center to that point. It's an easy way to look at a map and see what kind of real-world access the transit in your immediate area provides.
Since this tool uses real Ricmond data and the actual three RTNP concepts (Familiar, High Coverage, and High Ridership), you can compare and contrast how each concept will impact your very own life. That's pretty awesome!
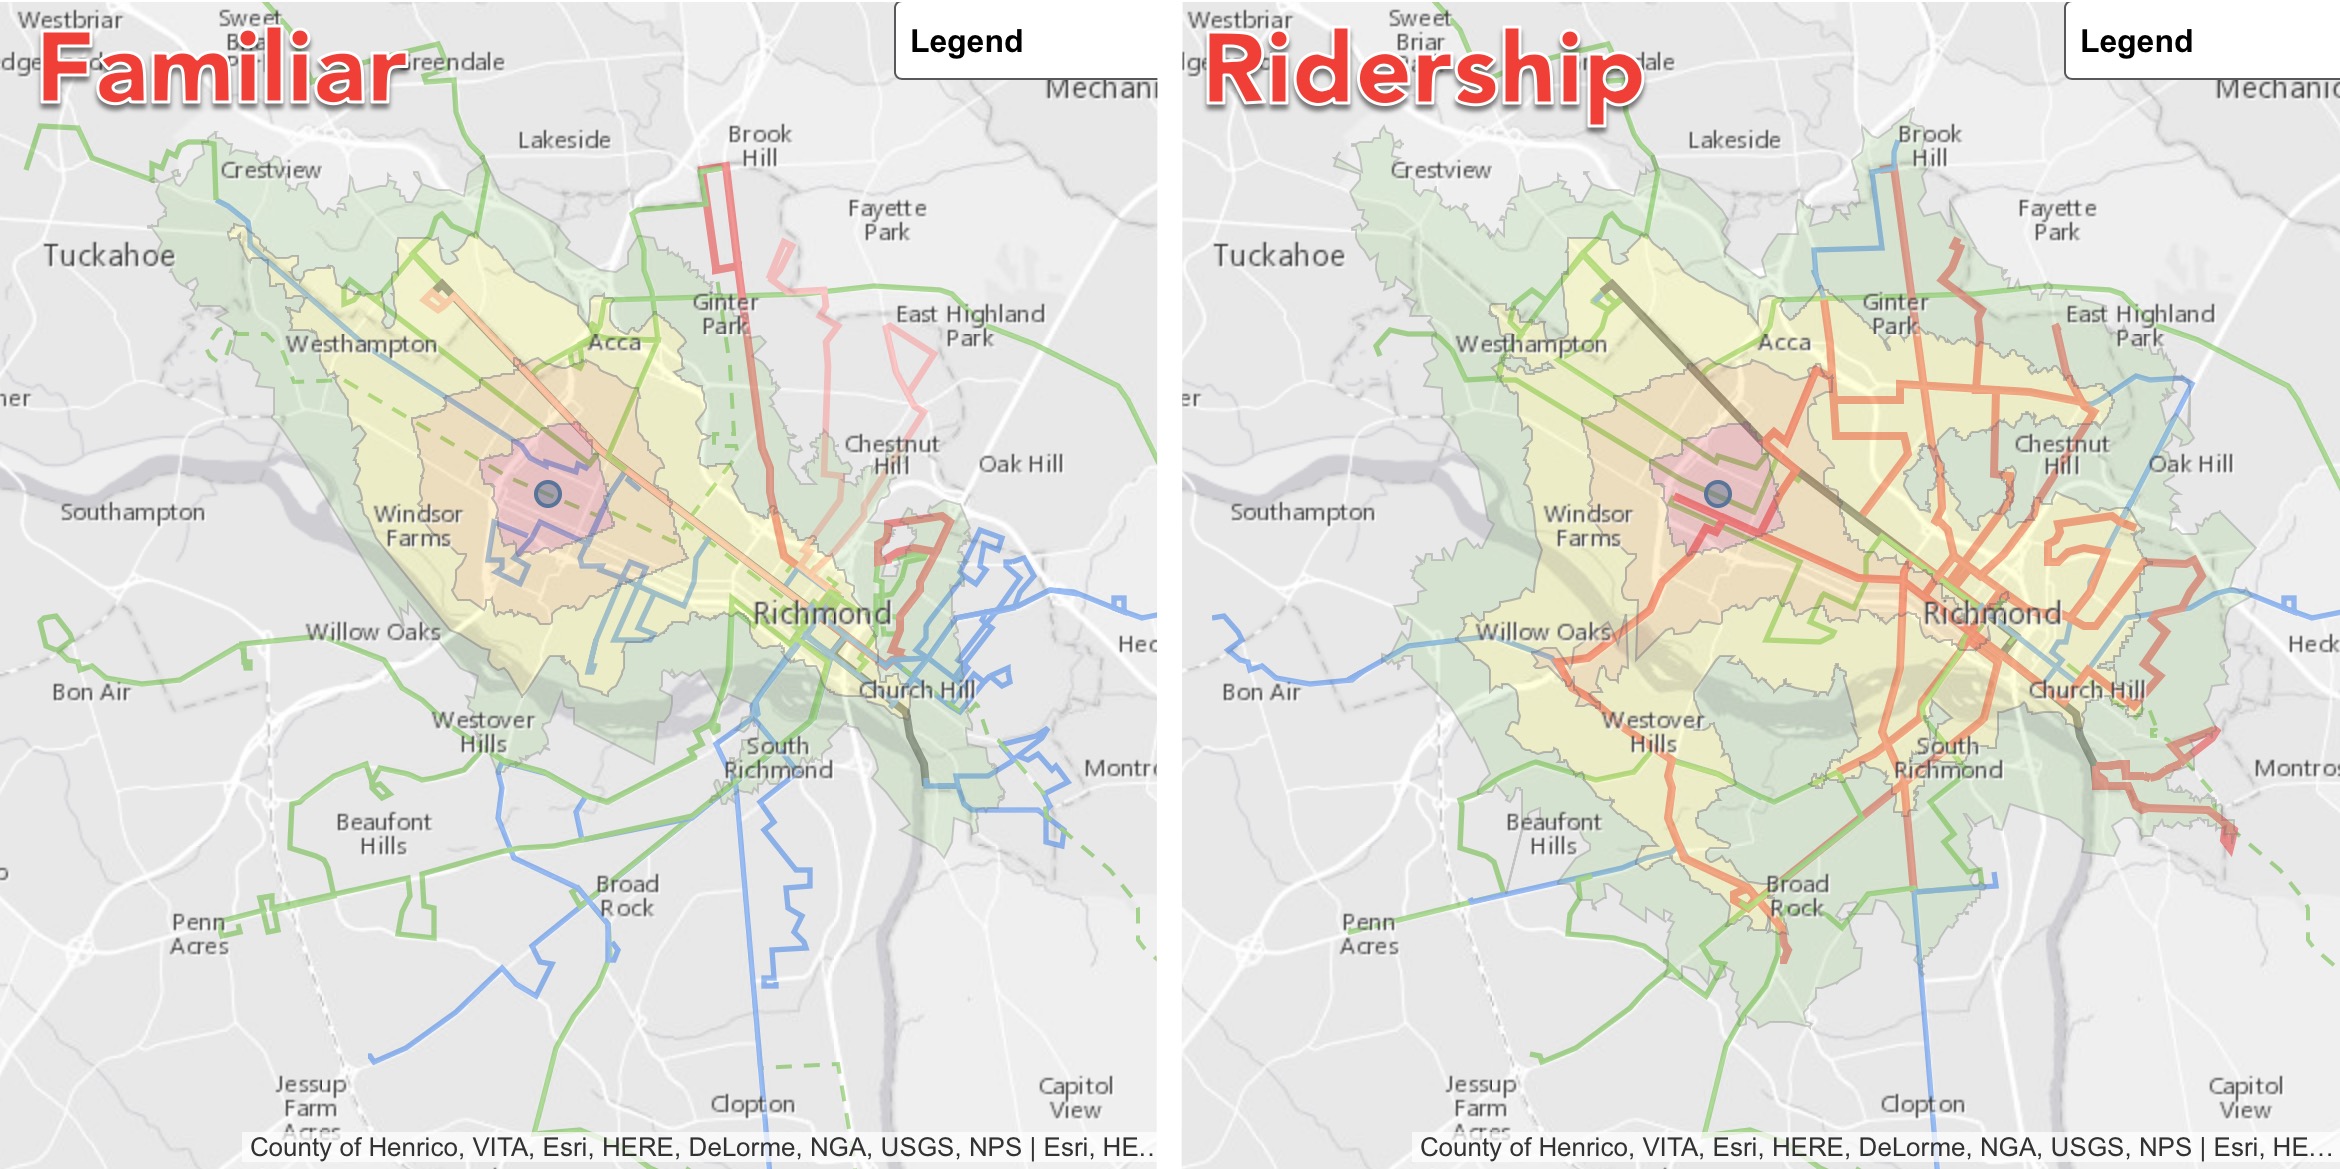
Here's a quick example for folks living in the Museum District:
Or for people up on the Northside:
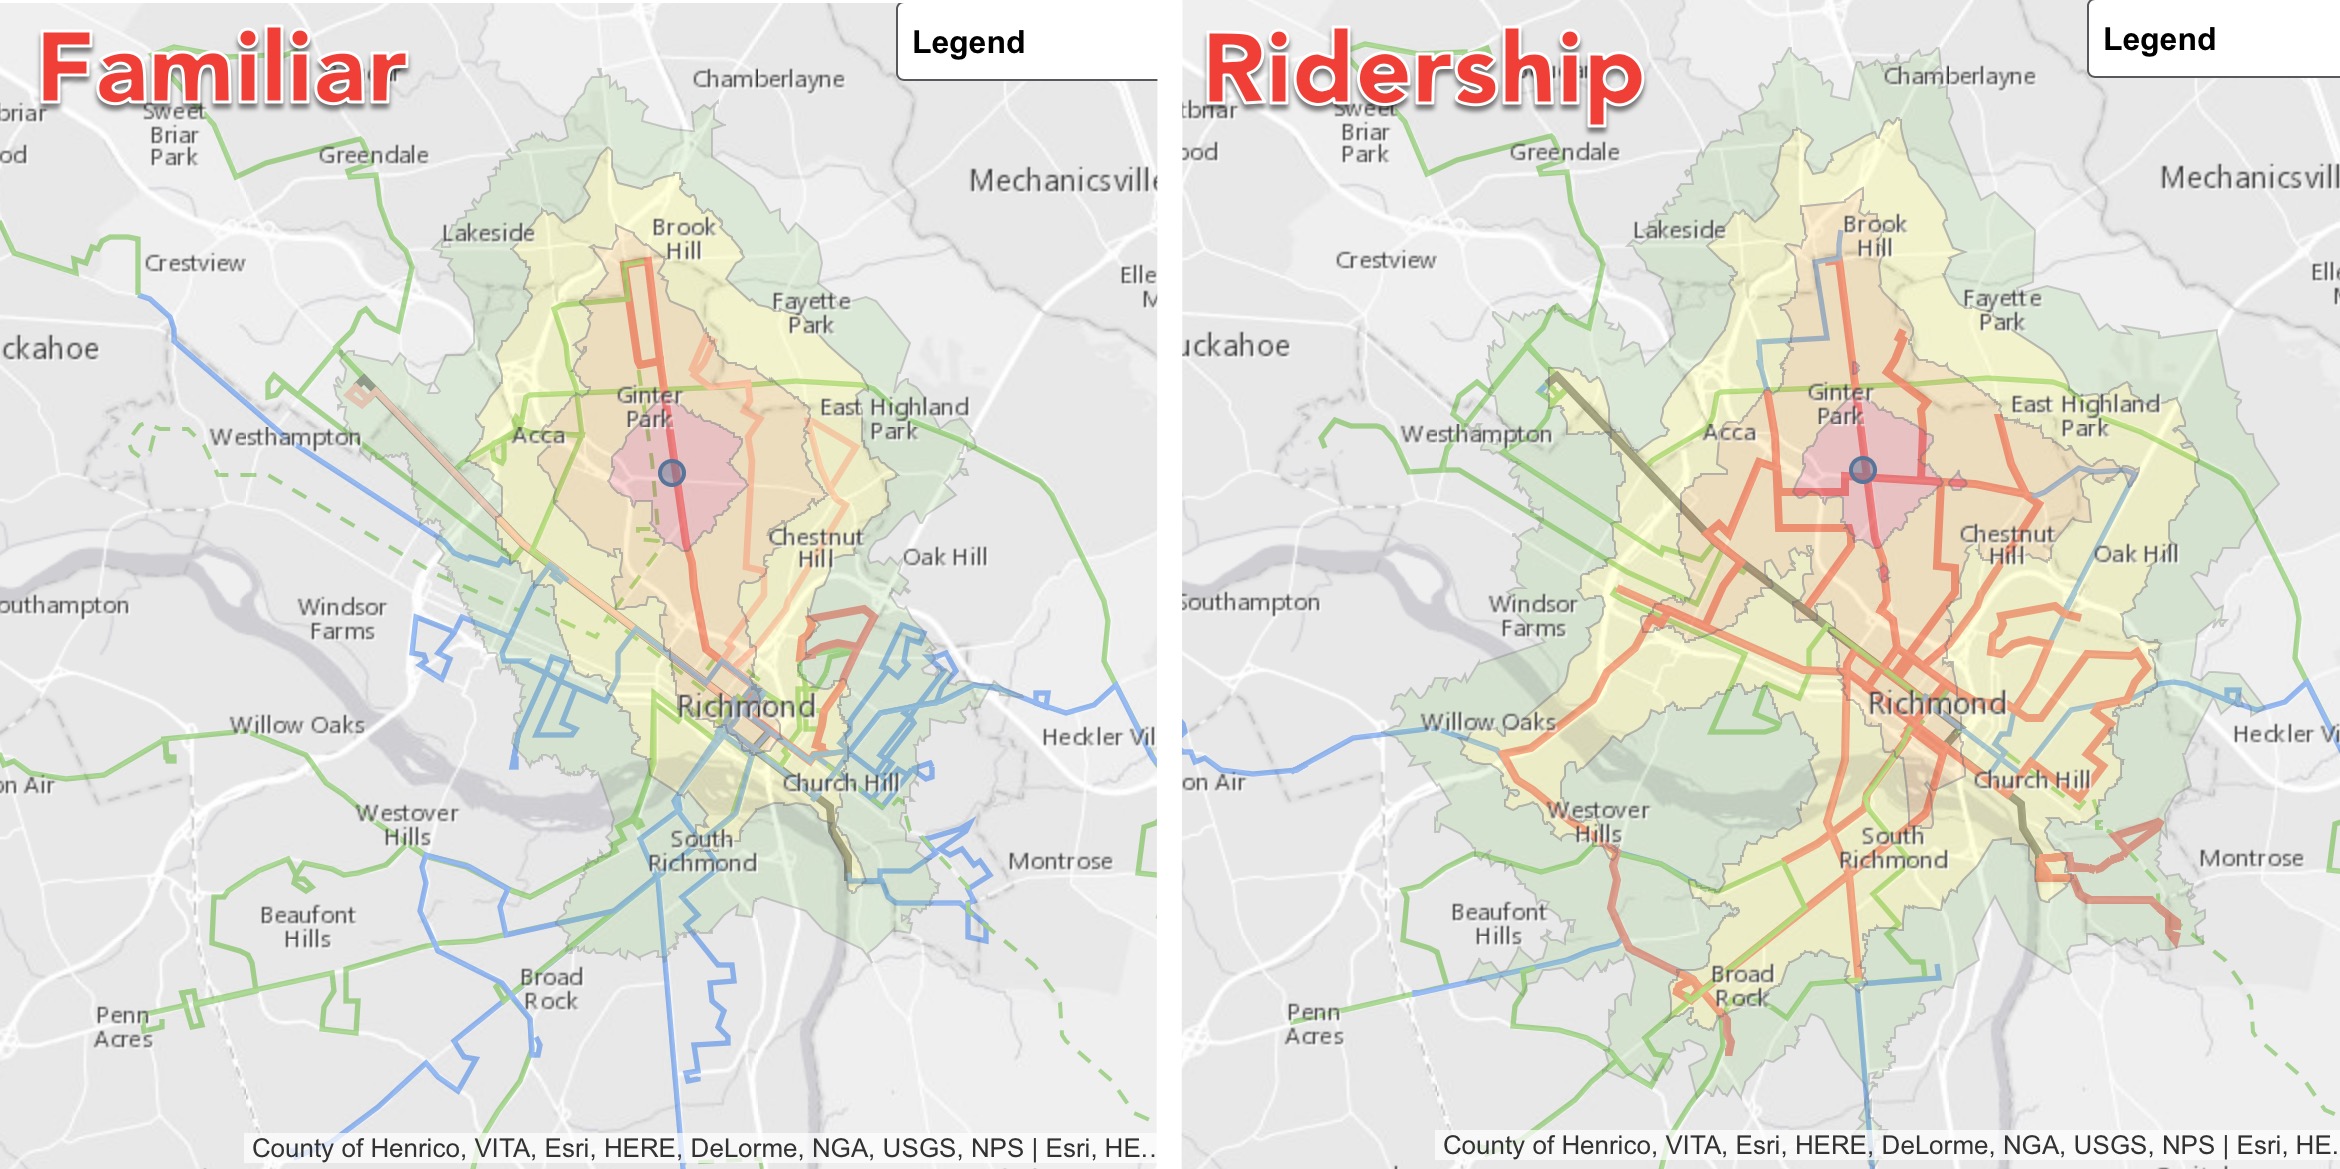
Notice how in both of the above examples, the Familiar Concept (which is basicaly the system we have now with a few tweaks) prioritizes getting you downtown to the exclusion of almost everything else. Once you're down there, you're probably waiting at the Transfer Center for your next bus.
The Ridership Concept dramatically broadens your access and let's you get to all sorts of places in the city in the same amount of time without going through the Transfer Center.
So take some time to click around on the map and marvel at just how much more access the High Coverage and especially the High Ridership concept provide. Then, if you haven't already, take the online survey and let them know which concept you prefer!